ChiliProject is not maintained anymore. Please be advised that there will be no more updates.
We do not recommend that you setup new ChiliProject instances and we urge all existing users to migrate their data to a maintained system, e.g. Redmine. We will provide a migration script later. In the meantime, you can use the instructions by Christian Daehn.
Issue status history (Bug #689)
Added by Bas de Bruijn at 2011-11-08 05:54 pm.
Updated at 2011-11-10 09:45 pm.
Description
Hi,
The thing i miss currently in Redmine is the visualization of the history of issues.
For management of projects i want to draw a chart of the amount of open and closed issues per week. Now i export an excel sheet and with a pivot table i try to visualiseren the progress.
The problem is that I have the "created" date and the "last updated" date. However not the date an issue has been closed. In other words, I am not able to make a chart in the time. (MantisBT does this per default functionality).
Is there a way to get the data of the status change in table format so I can utilize Excel to draw the chart?
Thanks in advance.
Bas
History
Updated by Felix Schäfer at 2011-11-09 08:32 am
There's currently no way to know when an issue has been closed other than to parse the history of the issue, and I think that's something you don't get in the exports currently.
The only way I can think of to do week over week comparisons is too look at the open and closed numbers now and look at them again next week and make the difference, sorry.
Updated by Bas de Bruijn at 2011-11-09 03:57 pm
a quick workaround:
I now add a few columns where i change the date to plain text.
I use the pivot table for a column "created date", get the cumulative numbers
I change then the pivot table to the column "closed date" (this column checks the status, and if it is "closed" i get in the column "closed date" the plain text of "last updated date".
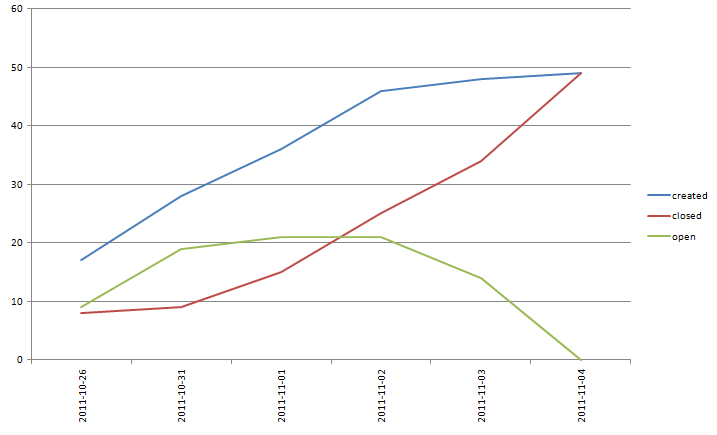
i copy paste this to a new worksheet, do some quick shifting and i subtract the "closed date" numbers from the "created date" numbers to get the attached result.
Would be nice to have this simple functionality in the software.
Bas
- File created-closed-open_chart.png added
Updated by Eric Davis at 2011-11-10 08:58 pm
Bas de Bruijn wrote:
Would be nice to have this simple functionality in the software.
It wouldn't be that simple. Once an issue is closed it can be reopened. Or if an issue status is changed from open to closed (or from closed to open) then the entire history for each issue would need to be recalculated to update the closing date. That's one of the drawbacks of being flexible, creating historic metrics gets difficult.
I agree with you that it would be a nice feature to have. Just that it would take a lot of work than it first appears.
Updated by Bas de Bruijn at 2011-11-10 09:45 pm
Ok, I understand.
I use this with excel now to give a visual feedback of the progress to people in my project team, and stakeholders of the project. We make big machines and for each machine of that specific family I make a version. A few weeks before delivery I get together each day 15 minutes with the production guys and provide them with a structure for reporting issues. When all is done I close the version.
So bottom line, I want to give a visual representation of the progress we make in a simple and understandable way.
Bas